An
official website of the United States government.
Here's how you know we're official.
An
official website of the United States government.
Here's how you know we're official.
An
official website of the United States government.
Here's how you know we're official.
An
official website of the United States government.
Here's how you know we're official.

Office
of
Coast
Survey
This project aims to develop a high-resolution regional ocean forecasting system along the entire U.S. West Coast, providing accurate forecasts of sea level, currents, temperature, and salinity 3-7 days in advance. These forecasts will provide guidance for ship route monitoring and planning, commercial and recreational fishing, search-and-rescue operations, and environmental hazard response.
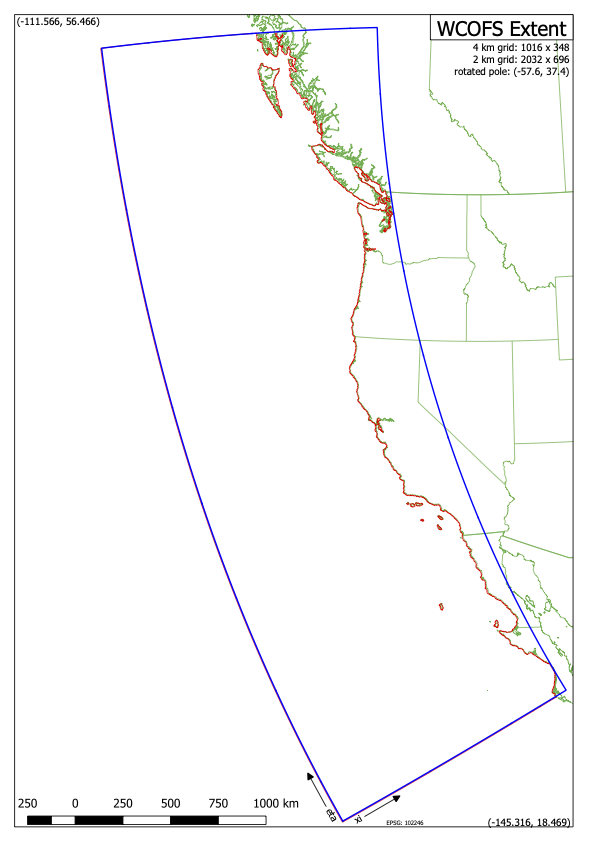
WCOFS is based on Regional Ocean Modeling System (ROMS), an open-source simulation of three-dimensional flows in the stratified ocean over a complicated slope topography and coastal shelf. The system can simulate both tidally and wind-driven flows, as well as upwelling of colder subsurface waters in summer months, instabilities and eddies of coastal currents, and both the transport and mixing of fresh water from riverine output. The WCOFS spatial domain, shown in the figure, stretches along the western coast of the North American continent from 24 N (Mexico) to 54 N (British Columbia). Extension of the domain south of the U.S. border is necessary to accurately represent the impact of long coastally trapped waves propagating along the shore in a northerly direction. Depending on application, the horizontal resolution is either 2 or 4 km (see detail below). Forty stacked layers are used in the vertical direction, following the topography of the ocean floor.
The system is comprised of two main components; an ocean circulation model (modeling the fluid dynamics of ocean conditions), and a data assimilation system (combining results from the circulation model with available oceanic observations to arrive at a more accurate estimate of present ocean conditions, which then becomes the starting point for a more accurate future forecast).
First, multi-year ocean circulation model simulations are run without data assimilation at 2 km resolution as part of the model skill assessment. The simulation for 2009-2014 was analyzed at the earlier stages of the project; skill assessment results and dynamical analyses were presented in two publications [ Kurapov et al., 2017a , Kurapov et al., 2017b ]. More recently, a new non-data-assimilative simulation (“Exp37”) was run for 2013-2017, including both the “warm blob” conditions of 2014 and the 2015-2016 El Niño event. Forcing for this simulation included atmospheric fields from the 12 km resolution North American Mesoscale Forecast System (NAM) , non-tidal boundary conditions from the 1/12th degree resolution global Navy's HYCOM-based forecast system , tidal conditions from TPXO tides , and fresh water discharges from major rivers along the coast.
Outputs saved from Exp37 (5-year records):These fields are made available to our partners for analysis [ Fredrickson et al., 2019 ], or to provide boundary conditions for smaller scale and / or or higher-resolution models. Please contact us ( alexander.kurapov@noaa.gov ) if you would like to work with the outputs.
Second, a data assimilation system has been developed with the 4 km resolution version of WCOFS. Real-time testing of the application has now been transitioned to the NOAA Center for Operational Oceanographic Products and Services (CO-OPS) . This system provides everyday updates of day 1-3 forecasts. The model forcing is similar to that described above, except the non-tidal boundary conditions come from the NOAA Global Real-Time Ocean Forecast System (RTOFS) . Data assimilation for WCOFS implements the ROMS 4-dimensional variational (4DVAR) system, utilizing observed surface sea surface currents (SSUV), sea surface temperature (SST), and sea surface height (SSH).
Assimilated data:The interactive viewer shows a side-by-side comparison between the observational data above and forecasts fields from WCOFS (data-assimilative and non-data-assimilative), along with forecast fields from RTOFS for reference. Presently, the viewer shows daily-averaged fields from the WCOFS, RTOFS, and HF radar sources, as well as daily mosaics of SST from VIIRS.
Coastal Ocean Models